A Publication of the
Applied Math and Science Education Repository

The AMSER Science Reader Monthly aims to provide educators with a useful package of information about a particular topic related to applied math and science by combining freely available articles from popular journals with curriculum, learning objects, and web sites from the AMSER portal. The AMSER Science Reader Monthly is free to use in the classroom and educators are encouraged to contact AMSER with suggestions for upcoming issues or comments and concerns at [email protected].
This month's AMSER Science Reader Monthly topic is Air Pollution.
The Long Fight Against Air Pollution
Article from Smithsonian Magazine by Brian Vastag
Synopsis and resource annotations by Max Grinnell
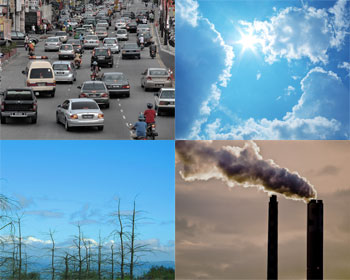
In 1952, a massive smog bank settled over London and it was responsible for approximately 12,000 deaths during the coming months. It served as a wake-up call to Britons, and four years later the United Kingdom passed a set of broad air pollution regulations. The United States followed suit in 1970 when the federal government created the Environmental Protection Agency (EPA) and also passed the Clean Air Act.
There remains much to be done in terms of air quality in the United States, and this article by Brian Vastag for the Smithsonian magazine website takes a close look at the future of regulating indoor air quality and the concentrations of ozone throughout the country.
The piece begins with a brief history of air pollution regulation in the US, and then begins to offer some perspective on how the EPA has modified its standards over the past several decades. In recent years, there has been a great push from citizens groups and others to work on issues including radon and indoor smoking bans.
The article goes on to describe particulate pollution and the "Six Cities" study done by Harvard University, which was begun in the early 1970s. That research determined that the study area with the fewest particles (Portage, Wisconsin) had 26 percent fewer deaths from lung and heart diseases than Steubenville, Ohio, which had the dirtiest air. As a result of this study, the EPA tightened its regulations on particulate pollution in 1997, and the agency began regulating particles as small as 2.5 microns across.
Vastag concludes the article discussing the challenges involved with lowering the concentrations of ozone, which forms when sunlight reacts with various pollutants. The EPA tightened its ozone limit in 2008, and an even more restrictive standard is currently on the table. Of course, there is also the question of greenhouse gases, and in 2009, the EPA declared them to be dangers to human health. While the EPA does not regulate emissions of these gases, the agency has recommended that Congress pass comprehensive climate change legislation.
Found below is a list of useful resources that will illuminate and enhance understanding of the topics found within this article. The first link leads to "An Introduction to Indoor Air Quality", provided by the EPA. The second link will take interested parties to a case based lesson plan from the BioQUEST Curriculum Consortium. Here users will find a lesson plan that has students generating maps of ozone concentrations, graphing air quality indices, and proposing solutions to air quality problems. The third link leads to a travel emissions calculator that can be used to determine emissions from a variety of transportation methods. Moving on, the fourth link leads to a lesson plan created by the National Park Service to introduce students to the world of air quality issues. The fifth link leads to another resource created by the EPA that allows users to determine how clean their electricity source (or sources) might be. Finally, the last link leads to an activity that helps students determine the total nitrogen oxide emissions from sources that include coal-fired power plants and gas-powered lawnmowers.


